# Workbench Layout
The Flow360 workbench provides an intuitive interface for computational fluid dynamics (CFD) simulations. This document describes the key areas of the workbench layout and their functions.
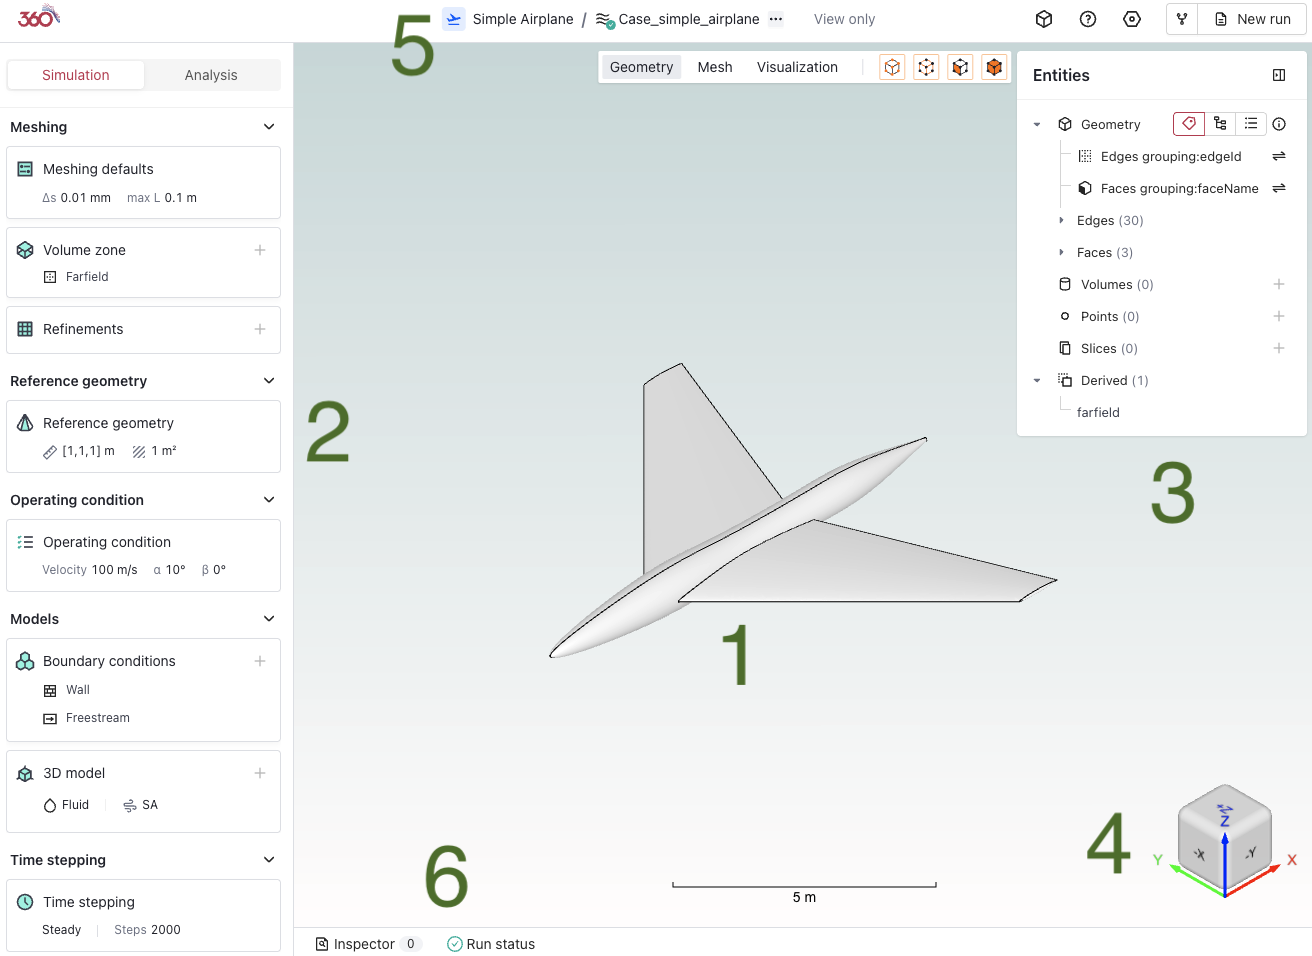
# 📋 Main Interface Sections
| Section | Description |
|---|---|
| 1 | Viewer region |
| 2 | Simulation setup / Analysis |
| 3 | Entities browser |
| 4 | Coordinate system |
| 5 | Top navigation bar |
| 6 | Bottom status bar |
# 🔍 Detailed Descriptions
# 1️⃣ Viewer region
The central workspace where the geometry, mesh, and simulation results are displayed. This interactive 3D viewport allows you to:
- Rotate, pan, and zoom the model
- Select and inspect geometric features
- Preview created entities such as volumes or slices
- View mesh details
- Visualize simulation results and flow fields
Viewer bar allows you to switch between different modes as well as choosing selection options.

Note: Click right-mouse button while hovering in the model view area to see additional settings.
# 2️⃣ Simulation setup / Analysis
A comprehensive control panel containing all simulation parameters and settings, organized into collapsible sections:
- Meshing parameters
- Reference geometry
- Operating conditions
- Physical and numerical models
- Time stepping configuration
- User-defined dynamics
- Output settings
# 3️⃣ Entities browser
Dedicated controls for visual representation of the model and results:
- Geometry display options
- Mesh visualization settings
- Results visualization tools
- Display modes and rendering options
# 4️⃣ Coordinate system
A persistent coordinate system indicator showing:
- X, Y, and Z axes orientation
- Current view direction
# 5️⃣ Top navigation bar
Primary navigation and tool selection area containing (from left to right):
- Return to Flow360 dashboard
- Project tree
- Information about the current selected asset
- More button
- View only information (optional)
- Assets
- Help
- Project settings
- Fork / run case
# 6️⃣ Bottom status bar
Information and status display showing:
- Current operation status
- Progress indicators
- Inspector tools
- Run status information
💡 Tips
- Click items in the left sidebar to expand/collapse sections
- The interface can be customized to show/hide various panels
❓ Frequently Asked Questions
How do I reset the view to default?
Use the home button in the view controls or press the Home key.
Can I customize the layout?
Yes, panels can be resized, minimized, or rearranged to suit your workflow.
How do I access advanced visualization options?
Advanced visualization settings are available in the top-right region (Section 3).
Where can I monitor simulation progress?
The bottom status bar (Section 6) shows current simulation status and progress.